Cause and Effect diagram and Pareto analysis are two of the seven basic QC tools. When both these tools are used together, they provide a complete picture of a problem. Cause and Effect Diagram Cause and Effect Diagram is a technique for identifying the possible causes of an observed problem or effect and helps to trace/identify the root cause of the problem for removing them. This is also called Fish Bone diagram (or) Ishikawa Diagram. It is a simple but powerful tool for getting to the bottom of the problem.
It can be used to:
- Define a problem
- Break problems down into their constituent elements
- Help generate ideas / add structure to brainstorming
- Identify relationships between causes (which are often present but hidden)
- Assist decision making
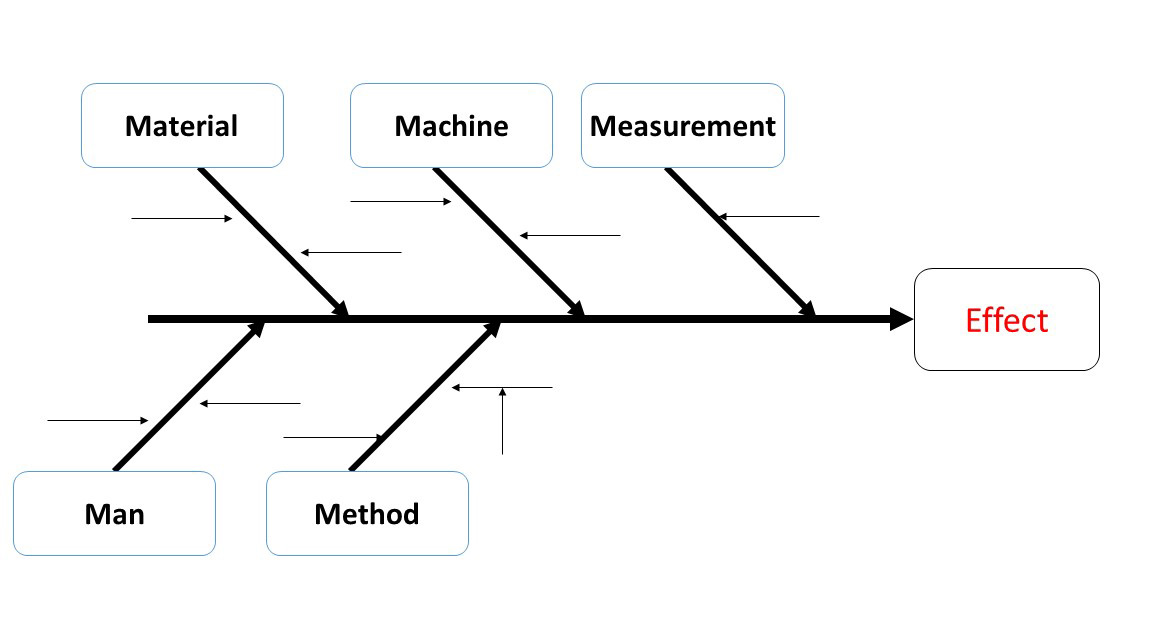
Steps to create the Fish Bone diagram
- Name the Head of the fish with the exactproblem
- Draw minimum of five branches as shown in figure depicting 5Ms – Machine, Material, Method, Man and measurement.
- Brainstorm with the team to determine:
- What can be the possible causes
- Search causes among machines first, then material, method, man, and measurement.
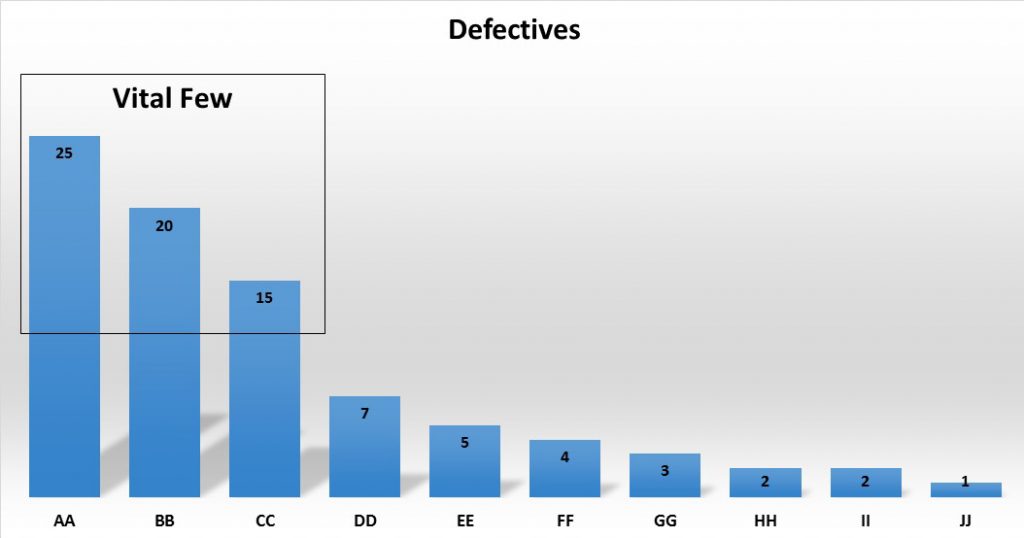
Pareto analysis According to Pareto analysis,80 % of the problems are caused due to 20% of the causes. Hence if we focus on the vital few causes, the majority of the problem can be solved. It saves precious time in solving a problem. This is a universal philosophy and can be applied anywhere. Example:
- In a nation, 80% of the wealth is owned by 20% of the people and the remaining 20% of the wealth belongs to 80% of the people
- In the Purchase department, 80% of the total purchase value would be contributed by the top 20% of the items